Graphical representation
x-t (distance-time) graph
v-t (velocity-time) graph
a-t (acceleration-time) graph
x-t (distance-time) graph
1. If the speed of the object is uniform
The graph will be a straight line.
The slope of the straight line tells the particles and their average speed.
The average velocity of the particle is equal to the instantaneous velocity.
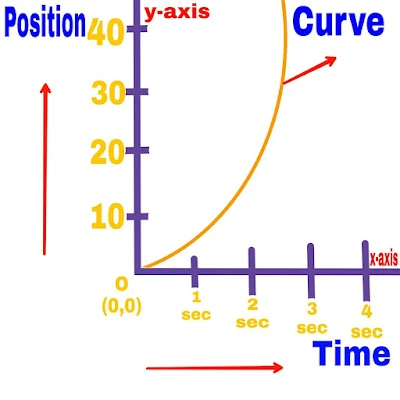
2. If the speed of the object changes
In this situation the velocity of the object changes with time.
In this situation the graph drawn will be a curve whose slope will be different in different intervals.
The average velocity and instantaneous velocity of the particle are different.
3. Displacement Of Object With Time under Different Circumstances
(a).
In this situation the object is at rest.
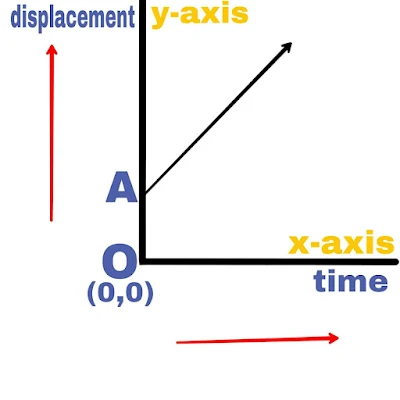
(b).
The slope of the time displacement graph is positive. Hence the object is move with a constant velocity.
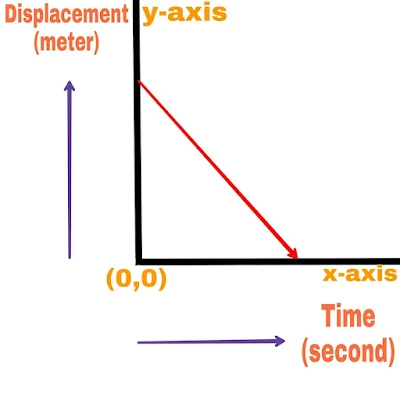
(c).
The slope of the time displacement graph is negative and constant and the object is moving with a constant negative velocity.
(d).
The slope of the time displacement graph is different at different points. But it is increasing with time.
(e).
The slope of the time displacement graph is changing with time.
The velocity of the object is increasing at O-A.
The velocity of the object is decreasing at A-B.
The velocity of the object at B is zero.
The velocity of the object at B-C is negative.
v-t (velocity-time) graph
Velocity is drawn along the y-axis and time along the x-axis.
1. If the object moves with uniform velocity
The velocity time graph will be a straight line parallel to x-axis.
The velocity time graph and the area of the region bounded by the time axis express the distance traveled by the object in a given time interval.
Therefore, in the above graph, the distance traveled by the object in the time interval (t₂-t₁),
S=v(t₂-t₁)
S=Area of rectangle BC(t₂-t₁)
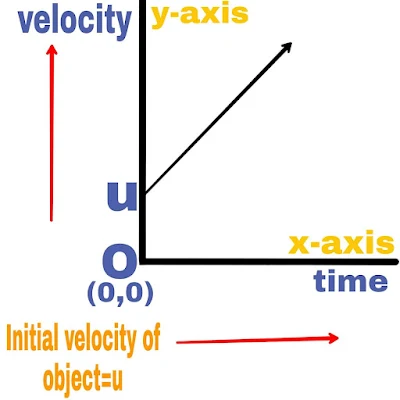
2. If the velocity of the object is increasing at a uniform speed
(a).
The slope of the velocity time graph represents the acceleration of the object.
The velocity of the object at point A of the straight line is v₁ and the velocity of the object at another point C is v₂.
Therefore, the change in velocity of the object in the time difference (t₂-t₁) is (v₂-v₁).
Hence the acceleration of the object,
a = BC/AB
a=(v₂-v₁)/(t₂-t₁)
a=∆v/∆t
(b).
If the object is moving with uniform velocity then its average acceleration and instantaneous acceleration will be equal.
Average Acceleration = Instantaneous Acceleration
∆v/∆t=dv/dt
3. If object is moving with variable velocity
In this situation, to find the slope of the object at points P and Q, the change in velocity corresponding to straight line PQ is (v₂-v₁) and time interval (t₂-t₁)=∆t,
average speed,
⃗a=∆v/∆t
and instantaneous acceleration,
⃗a=Limₓ→₀∆v/∆t
where x=∆t
⃗a=dv/dt
a-t (acceleration-time) graph
1. If the particle is at rest
If the particle is at rest, then the velocity and acceleration of the particle at rest is zero.
Hence the graph will be superimposed on the time axis.
2. If the object moves with a constant velocity
In other words,
Acceleration = zero
In this case the graph will be represented on the time axis only.
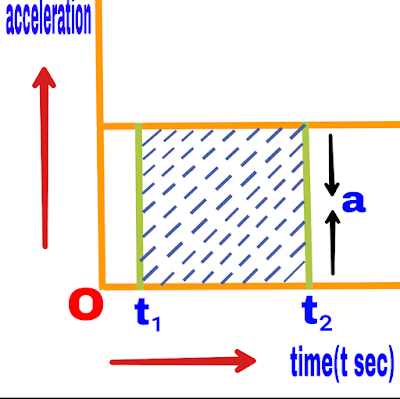
3. If the object moves with a constant acceleration
Acceleration = zero
In this case the graph will be represented on the time axis only.
3. If the object moves with a constant acceleration
If an object moves with a constant acceleration, the time acceleration graph will appear as follows.
With the help of this graph, the change in velocity ∆v of a moving object between any two time intervals t₁ and t₂ can be calculated.
a=(velocity change)/time
a=∆v/∆t
∆v=a.∆t meter/second
Read more...





-min.jpg)
-min.jpg)
0 Comments
Post a Comment